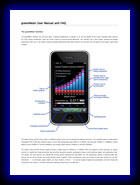
Featured in the NY TImes, LA Times, Wired Autopia, and other publications, greenMeter is an app for the iPhone and iPod Touch that computes your vehicle's power and fuel usage characteristics and evaluates your driving to increase efficiency, reduce fuel consumption and cost, and lower your environmental impact. Results are displayed in real time, while driving, to give instantaneous feedback.
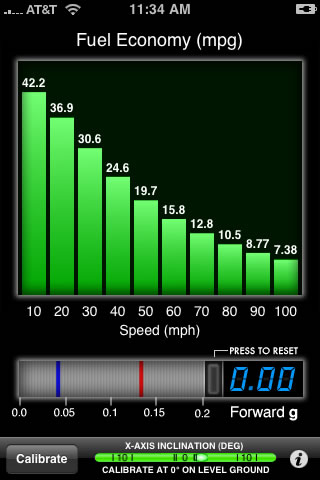
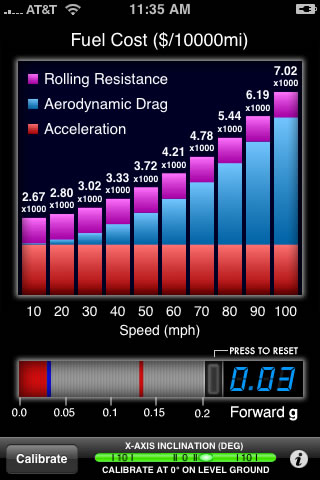
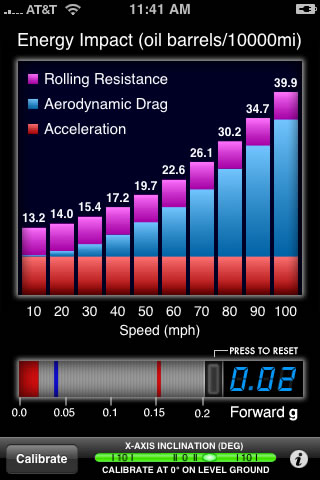
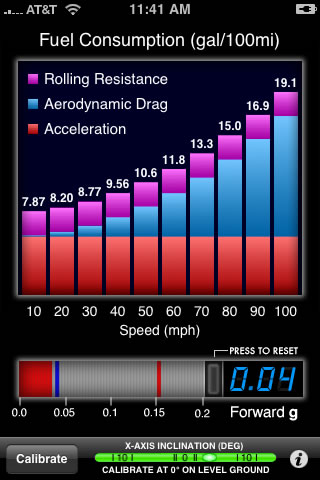
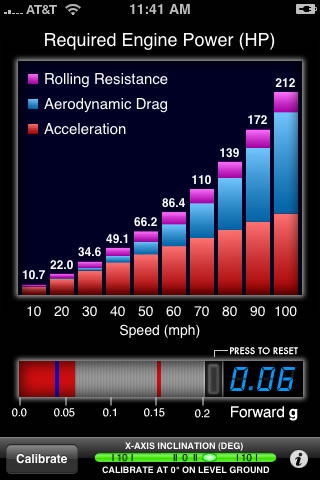
Though it's most effective on the road, you can learn from greenMeter even before you get in the car. By tipping the device forward and backward to simulate acceleration, you can see the effects of acceleration, aerodynamic drag, and rolling resistance across the speed range. Then implement this knowledge on the road, by choosing an efficient cruising speed and using the built-in eco-driving displays to moderate acceleration while you drive.
If you're into hypermiling or eco-driving, want to make your transportation more efficient, or are simply interested in maintaining a green lifestyle, give greenMeter a try! The software can pay for itself within 1-2 tanks of gas.
Screenshots

Details
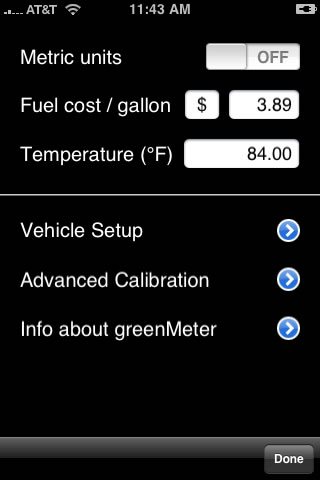
Using accelerometer data and the advanced physics engine from the gMeter app, greenMeter computes power, fuel usage/cost, crude oil consumption, and carbon emission (data can be shown in US or metric units). Thanks to a novel algorithm that computes parameters over the entire speed range, the app does not need GPS, opening usage up to all generations of the iPhone and iPod Touch.
The app offers two calibration options for the accelerometer; one to correct internal offsets, and the other to set the forward direction when the device is positioned in a vehicle (see user manual for suggested positioning).
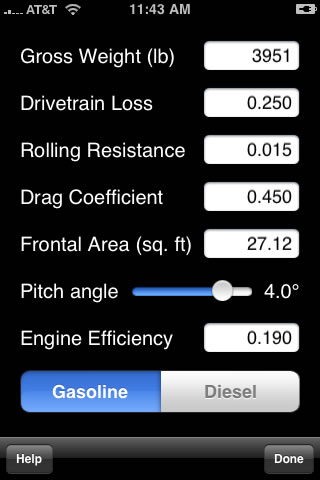
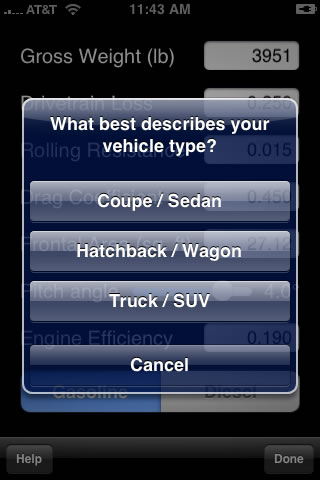
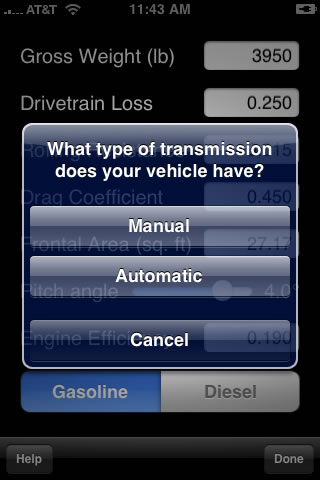
Settings and preferences, including inputs to specify vehicle, weather, and fuel characteristics, are accessed via the "i" button. The app offers an easy setup mode to help specify vehicle specs.
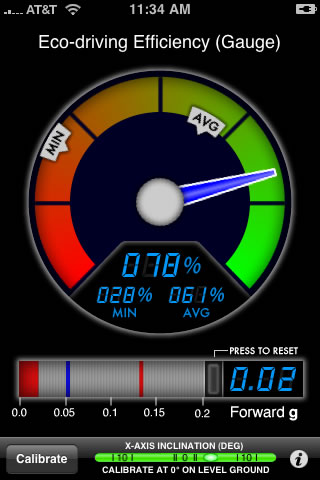
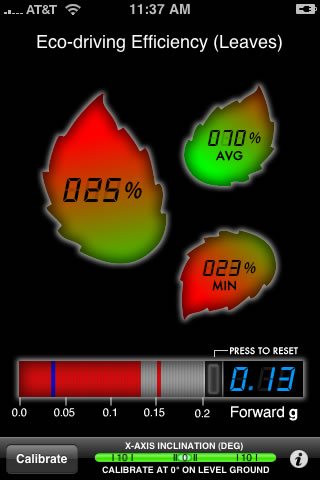
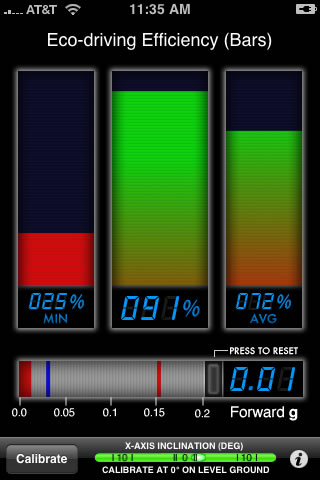
To switch between the various display modes, just tap the graphics. To reset avg/min levels, tap the "Reset" button near the g-meter.
Impact
First released in September 2008, greenMeter became a hit with consumers around the world. The app has been downloaded by users in over 60 countries.
greenMeter can help a typical driver save hundreds of dollars a year in fuel expenses, but when you look at the big picture, the benefit really adds up.
Based on a conservative estimate of worldwide use in its first year, greenMeter has likely saved about 2 million gallons of gas, reduced fuel expenses by over $5 million, dropped oil consumption by nearly 20,000 barrels, and prevented almost 47,000 tons of CO2 from entering the atmosphere.
This really demonstrates how technology can have a big environmental impact even when it's applied on a small scale.
Details
You can view the greenMeter user manual and FAQ by clicking the icon below:
Contact
If you have an issue or question, please contact:
Feedback, comments, and suggestions are welcome.
Demo Videos
Release Notes
Version 1.0 - 9/7/08
Initial public release
Version 1.1 - 9/28/08
Feature updates
Version 1.2 - 6/21/09
Minor updates for OS 3.0
Version 2.0 - 8/21/09
Major update
Buy Now
You can get greenMeter from iTunes for $5.99:

greenMeter works on any iPhone or iPod Touch. GPS is not required.